x=load('myfile.dat'); % load content of myfile.dat in an array x
dir; % display all files in the current directory (like ls)
f=dir; % creates a structured array of "files" objects
f=dir('*.dat'); % creates an structured array of data files objects
f(1).name; % return the name of the first file
for i=1:length(f); % for each file x=load(f(i).name); % load each file i myfunction(x); % do something with x end
save myfile var1 var2 ... -ASCIIor
save('myfile', 'var1', 'var2',...,'-ASCII')
or (if you want to index your file)
index=i;
myfile = sprintf('file%d.dat',index);
save(myfile, 'var1', 'var2',...,'-ASCII')
or (if you want to concatenate strings)
fileext='dat';
myfile = sprintf('myfile.%s',fileext);
save(myfile, 'var1', 'var2',...,'-ASCII')
fID=fopen('mytextfile.txt','w'); % file ID ('w' means "open or create new file for Writing")
myformat='%s\t%g\n'; % my format
D1='The value of pi is:'; % string data
D2=3.14159; % numeric data
fprintf(fID,myformat,D1,D2); % write in file
fclose(fID); % close file
type mytextfile.txt; % display the content of the file
nfig=1; % number of the figure set(nfig,'PaperPositionMode','auto'); % to keep aspect ratio when saving in file
saveas(gca,'myfigure.jpg','jpg'); % save current figure as jpg fileor
saveas(gca,'myfigure.eps','eps'); % save current figure as eps file
rand('state',sum(100*clock));
To generate...
z=rand()a 5x5 matrix of random values from a uniform distribution between 0 and 1:
z=rand(5)a vector of 5 random values from a uniform distribution between 0 and 1:
z=rand(5,1)a vector of 5 random values from a uniform distribution between 0 and 10:
z=10.*rand(5,1)a vector of 5 random integer values from a uniform distribution between 0 and 10:
z=ceil(10.*rand(5,1))a vector of 5 random values from a normal distribution of mean 0 and standard devation 1:
z=randn(5,1)a vector of N random values from a normal distribution of mean m and standard devation s:
m=5; % mean s=2; % standard deviation N=100; % number of numbers to generate z=m+s.*randn(1,N);a random number from a binomial distribution with parameters specified by the number of trials, N, and probability of success for each trial, p:
N=100; % number of trials p=0.7; % probability of success z=binornd(N,p);a matrix of n x m random values from a binomial distribution (with N trials and probability p of success):
N=10; % number of trials p=0.5; % probability of success n=5; m=5; z=binornd(N,p,[n,m])a matrix n x m of random values with proba p to get a non-null value (i.e. a "sparse" random matrix):
p=0.5; % probability to have a non-nul value n=5; m=5; z=rand(n,m).*binornd(1,p,[n,m])a vector of N random values from a log-normal distribution of mean m and standard devation s:
m=5; % mean s=2; % standard deviation N=100; % number of numbers to generate mn=log(m^2/sqrt(s^2+m^2)); sn=sqrt(log(s^2/m^2+1)); z=exp(mn+sn.*randn(1,N));a vector of N=100 numbers from a gamma distribution with mean m=5 and standard deviation s=5:
m=5; % mean s=5; % st dev N=100; % number of random numbers to generate a=m/s ; % shape parameter b=m^2/s ; % scale parameter x=gamrnd(a,b,[1 N]);a random permutation of the integers 1:n
n=8; z=randperm(n)random permutation of the elements of a vector
v=[2 4 6 8 10]; w=v(randperm(length(v)))
eq1=sprintf('a-(b+1)*x+x^2*y');
eq2=sprintf('b*x-x^2*y');
sol=solve(eq1,eq2,'x','y');
sol.x
sol.y
To solve equations numerically
a=2;
b=5.2;
eq1=sprintf('%d-(%d+1)*x+x^2*y',a,b);
eq2=sprintf('%d*x-x^2*y',b);
sol=solve(eq1,eq2,'x','y');
sol.x
sol.y
Selecting real solutions
eq1=sprintf('2/(1+Y^4)-X=0');
eq2=sprintf('2/(1+X^4)-Y=0');
sol=solve(eq1,eq2,'X','Y');
sol.X
sol.Y
x=eval(sol.X)
y=eval(sol.Y)
k=find(imag(x)==0);
sol=[x(k) y(k)]
%%% Data
x=[0 1.6 2.6 4.1 5.1 6.5 7.4 8.9 9.6];
y=[-10.3 0.2 13.5 23 41.9 45.7 60.1 78.0 88.2];
%%% Correlation coefficient (if R close to 1, linear fit OK)
R=corrcoef(x,y);
R(1,2)
%%% Fitting
n=1; % degree of the polynom (n=1 <=> linear fit)
p=polyfit(x,y,n)
%%% Write the function
fprintf('Best fit: y = %g x + %g nn',p(1),p(2))
%%% Figure
xfit=x;
yfit=p(1).*x +p(2);
plot(x,y,'bo',xfit,yfit,'r-');
xlabel('x');
ylabel('y');
legend('data','fit',2)
Exponential fit
%%% Data
t = [1:8] ;
x = [629 537 460 375 334 286 249 227] ;
%%% Define your exponential function
fh = @(t,p) p(1) + p(2)*exp(-t./p(3))
%%% Error function (to be minimized)
errfh = @(p,x,y) sum((y(:)-fh(x(:),p)).^2)
%%% Initial guess of the exponential parameters
p0 = [mean(x) (max(x)-min(x)) (max(t) - min(t))/2];
%%% Search for solution
P = fminsearch(errfh,p0,[],t,x)
%%% Write the function
fprintf('Best fit: x = %g + %g exp(-t/%g) nn',P(1),P(2),P(3))
%%% Plot the result
tt=[1:0.1:8];
plot(t,x,'bo',tt,fh(tt,P),'r-')
xlabel('t')
ylabel('x')
legend('data','fit')
| Time series plot | |
![]() |
T=[0:5] % this generates a vecteur T with number 0 to 5
D=rand(6) % this generates a 6x6 matrix with random number between 0 and 1
figure(1)
set(figure(1),'Position', [400 400 500 300]); % size of the figure
clf; % to clean the figure
plot(T,D(:,2),'b',T,D(:,3),'r.',T,D(:,4),'g--');
xlabel('Time (h)','fontsize',18);
ylabel('Variable (nM)','fontsize',18);
xlim([0 5]);
ylim([0 1]);
title('Here is a useless plot')
legend('x','y','z');
set(gca,'xtick',[0:0.5:6],'fontsize',14);
set(findobj(gca,'Type','line','color','blue'),'LineWidth',2);
|
| Symbols plot | |
![]() |
figure(3) clf; T=[1:5]; X=rand(5,1); Y=rand(5,1); Z=rand(5,1); plot(X,X,'rs','LineWidth',1,'MarkerEdgeColor','k','MarkerFaceColor','b','MarkerSize',10) hold on; plot(X,Y,'o','LineWidth',1,'MarkerEdgeColor','r','MarkerFaceColor','r','MarkerSize',15) hold on; plot(X,Z,'^','LineWidth',2,'MarkerEdgeColor','k','MarkerFaceColor','g','MarkerSize',15) Y=rand(5,1) grid on; |
| Scatter plot | |
![]() |
N=50; % number of points to generate
X=rand(1,N); % x-position
Y=rand(1,N); % y-position
Z=rand(1,N); % value (color) of the points
%s=50; % size of the points (same for all points)
%s=100*rand(1,N); % size of the points (random)
s=100*Z; % size of the points (same vector as color)
figure(1)
clf;
scatter(X,Y,s,Z,'filled')
annotation('arrow',[0.2 0.5],[0.2 0.5]) % draw arrow
box on;
|
| Error bar | |
![]() |
figure(1)
clf;
x=[0:0.5:10];
y=sin(x);
e=rand(1,length(x))/5
errorbar(x,y,e)
hold on;
plot([0 10],[0 0],'k--')
text(8,-0.15,'base line','fontsize',14,'HorizontalAlignment','center');
text(1,1.25,'maximum','fontsize',14,'HorizontalAlignment','left');
text(6,-1.25,'minimum','fontsize',14,'HorizontalAlignment','right');
xlim([-0.2 10.2]);
ylim([-1.5 1.5]);
box on;
|
| Double-y plot | |
![]() |
figure(1);
clf;
x1=[0:0.5:10];
y1=x1.^2;
x2=[0.2:0.2:20];
y2=1./x2;
[AX,H1,H2]=plotyy(x1,y1,x2,y2);
box off;
set(get(AX(1),'Ylabel'),'String','Square (x^2)','fontsize',18)
set(get(AX(2),'Ylabel'),'String','Inverse (1/x)','fontsize',18)
set(H1,'LineWidth',2)
set(H2,'LineWidth',2,'LineStyle','--')
xlabel('x','fontsize',18);
set(AX(1),'YLim',[0 100],'YTick',[0:10:100],'fontsize',15)
set(AX(2),'YLim',[0 1],'YTick',[0:0.2:1],'fontsize',15)
set(AX(1),'xlim',[0 10]);
set(AX(2),'xlim',[0 10]);
|
| Bar plot | |
![]() |
figure(4)
X=[1:10];
Y=rand(10,1);
bar(X,Y,'r');
xlabel('X','fontsize',18);
ylabel('Y','fontsize',18);
|
| Bar plot (multicolor) | |
![]() |
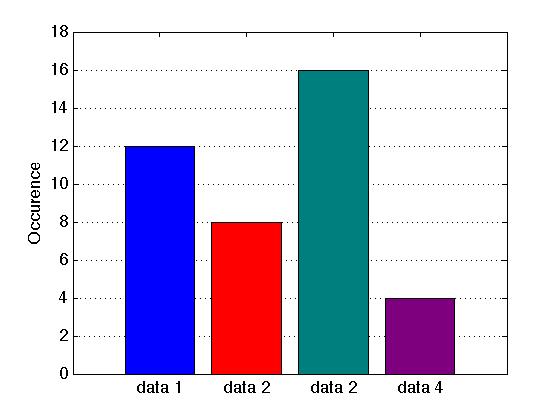
D=[12 8 16 4]; % data
figure(1)
b=bar(1:4,D); % bar plot
%%% trick to personnalize the color of each bar:
ch=get(b,'children');
cd=repmat(1:numel(D),5,1);
cd=[cd(:);nan];
set(ch,'facevertexcdata',cd);
colormap([[0,0,1];[1,0,0];[0,0.5,0.5];[0.5,0,0.5]]);
set(gca,'YGrid','on') % horizontal grid
ylim([0 max(D)+2]);
set(gca,'XTickLabel',{'data 1','data 2','data 2','data 4'},'fontsize',14)
ylabel('Occurence')
|
| Bar plot with error bars | |
![]() |
figure(1)
clf;
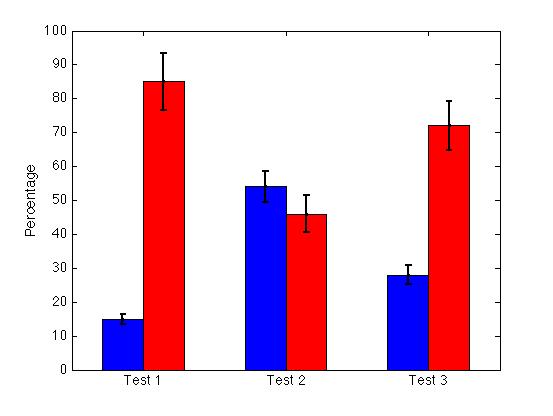
D=[15 85; 54 46; 28 72]; % data
S=[1.5 8.5; 4.6 5.4; 2.8 7.2]; % st dev (10%)
h=bar(D);
set(h,'BarWidth',1);
hold on;
ngroups = size(D,1);
nbars = size(D,2);
groupwidth = min(0.8, nbars/(nbars+1.5));
colormap([0 0 1; 1 0 0]); % blue / red
for i = 1:nbars
x = (1:ngroups) - groupwidth/2 + (2*i-1) * groupwidth / (2*nbars);
errorbar(x,D(:,i),S(:,i),'k.','linewidth',2);
end
set(gca,'XTickLabel',{'Test 1','Test 2','Test 3'},'fontsize',14)
ylabel('Percentage','fontsize',14)
|
| Histogram | |
![]() |
D=randn(50,1) % generates a vector with 50 numbers normally distributed
figure(2)
bin=[-4:0.2:4];
hist(D,bin);
xlabel('Value','fontsize',18);
ylabel('Occurrence','fontsize',18);
xlim([-4 4]);
ylim([0 8]);
set(findobj(gca,'Type','patch'),'FaceColor','b','EdgeColor','k')
text(-3,6,'this is a blue histogram')
|
| Histogram with several populations | |
![]() |
figure(2)
D1=randn(1000,1); % generates a vector with 1000 random numbers normally distributed
D2=2*randn(1000,1)+3; % generates a vector with 1000 random numbers normally distributed
x=[-5:0.5:10];
y1=hist(D1,x);
y2=hist(D2,x);
D=[y1; y2];
bar(x,D',1.4);
xlabel('Value','fontsize',18);
ylabel('Occurrence','fontsize',18);
|
| Box plot | |
![]() |
n=100; % number of data points / sample
D(1:n,1)=10+2*randn(1,n); % sample 1
D(1:n,2)=30+5*randn(1,n); % sample 2
D(1:n,3)=10+2*randn(1,n); % sample 3
D(1:n,4)=5+10*randn(1,n); % sample 4
figure(1)
clf
h=boxplot(D,'plotstyle','traditional','whisker',1.5);
%%% Some alternatives:
% 'plotstyle'= 'compact' => useful of many boxes
% 'whisker'= 1.5 (default) => increased not to display outliers
% 'colors'='k' => plot in black
set(findobj(gcf,'LineStyle','--'),'LineStyle','-') % solid lines
for b=1:4 % loop on boxes
for i=1:size(h,1) % loop on the "elements" of a box
set(h(i,b),'linewidth',3); % increase linewidth
end
end
mylabels={'Sample 1','Sample 2','Sample 3','Sample 4'};
mylabpos=[1:4];
set(gca,'XTickLabel',mylabels,'XTick',mylabpos,'fontsize',14);
|
| Fill polygons | |
![]() |
x = [1 2 4 7 9 4];
y = [4 9 9 7 3 1];
col=[0.2 0.6 0.2]; % colour (RGB)
fill(x,y,col);
xlim([0 10]);
ylim([0 10]);
set(gca,'XTickLabel',{''}) % to remove x tick labels
set(gca,'YTickLabel',{''}) % to remove y tick labels
set(gca,'XTick',[]) % to remove x ticks
set(gca,'YTick',[]) % to remove y ticks
%axis off; % to remove the box
|
| Color map | |
![]() |
X=rand(10);
imagesc(X);
colormap(jet); % instead of 'jet' try 'gray', 'bone', 'spring',...
% >>help colormap for more color options.
set(gca,'XTickLabel',{''}) % to remove x tick labels
set(gca,'YTickLabel',{''}) % to remove y tick labels
set(gca,'XTick',[]) % to remove x ticks
set(gca,'YTick',[]) % to remove y ticks
|
| Pie chart | |
![]() |
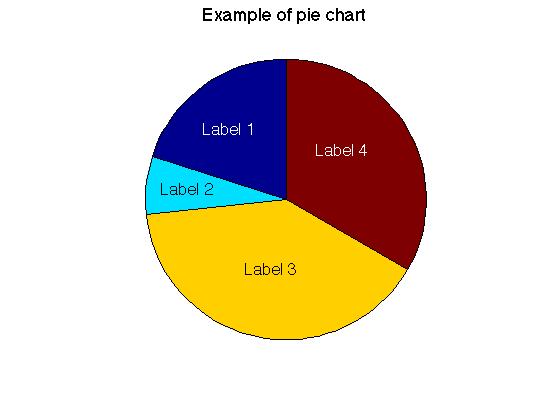
x=[30 10 60 50];
explode = [0 0 0 0];
%explode = [0 2 0 0];
labels = {'Label 1', 'Label 2', 'Label 3', 'Label 4'};
%labels = []; % to indicate percents instead of labels
h=pie(x,explode,labels); % try pie3 for 3D pie...
% NB: if no labels, the percentage are indicated.
%set(h(2:2:8),'fontsize',16); % sise of the labels
set(h(2),'fontsize',16,'position',[-0.4 0.5],'color','w'); % label 1
set(h(4),'fontsize',16,'position',[-0.7 0.07],'color','k'); % label 2
set(h(6),'fontsize',16,'position',[-0.1 -0.5],'color','k'); % label 3
set(h(8),'fontsize',16,'position',[0.4 0.35],'color','w'); % label 4
colormap jet
%set(h(1),'facecolor','m'); % change color of piece 1 into magenta
title('Example of pie chart','fontsize',18)
%set(gca,'position',[0.13 0.11 0.775 0.815]) % to change plot position
legend('lab1','lab2','lab3','lab4','location',[0.75 0.7 0.2 0.2])
|
| Plot 3D | |
![]() |
figure(8) clf; x=[0:0.01:40]; plot3(x.*sin(x),x.*cos(x),x,'b') box on; |
| Surface | |
![]() |
x=[1:0.2:10];
y=[1:0.2:10];
for i=1:length(x)
for j=1:length(y)
z(i,j)=1./x(i).*sin(y(j));
end
end
figure(2);
clf;
surf(x,y,z);
|
| Contour | |
![]() |
z=peaks; % demo data figure(2) clf; n=8; % number of contour plot (not mandatory) contour(z,n,'linewidth',2); %%% To write level on the contour lines: % [C,h]=contour(z,n,'linewidth',2) % set(h,'ShowText','on','TextStep',get(h,'LevelStep')*2) %%% Alternative representations: % contourf(z,n) % to fill the regions between the contours % contour3(z,n) % to draw the contours in 3D |
| Surface + contour | |
![]() |
z=peaks; % demo data
figure(4)
clf;
h=surfc(z);
clev=-8; % z-level of the contour lines
for n=2:numel(h)
z=get(h(n),'zdata');
set(h(n),'zdata',ones(size(z))*clev); % Contours are draw at z=clev
end
|
| Density | |
![]() |
z=peaks; % demo data figure(3) clf; niter=1; method='bilinear'; y=interp2(z,niter,method); imagesc(y); |
| Geometrical shapes | |
![]() |
%%% background colors
whitebg([1.0 1.0 0.6]) % background color (in+out plot)
set(gcf,'Color',[0,0.4,0.4]) % background color (out plot only)
%%% circle
circle = rsmak('circle');
fnplt(circle)
set(findobj(gca,'Color','blue'),'Color','r','LineWidth',2)
xlim([-1.5 5])
ylim([-1.5 5])
axis square
%%% ellipse
hold on;
S=[2,1]; % stretch
T=[2;3]; % translation
a=35*2*pi/360; % rotation angle
R=[cos(a) sin(a);sin(a) -cos(a)]; % rotation matrix
ellipse = fncmb(circle,[S(1) 0;0 S(2)]); % stretch
rtellipse = fncmb(fncmb(ellipse, R), T ); % rotate
fnplt(rtellipse)
set(findobj(gca,'Color','blue'),'Color','b','LineWidth',4)
%%% rectangle
hold on;
c=[0.0 0.6 0.4];
rectangle('Position',[2.5,0.5,2,3],'LineWidth',2,'facecolor',c,'edgecolor',c)
%%% rounded rectangle
hold on;
rectangle('Position',[0.5,-0.2,3.2,1.3],'Curvature',[0.8,0.4],'LineWidth',2,'facecolor','b')
%%% triangle
hold on;
h=patch([0 1 2], [3 4.5 3],'g');
set(h,'facecolor',[0.6 0.0 0.4],'facealpha',0.7)
|
| Voronoi plot | |
![]() |
N=30; % number of cells
x=rand(1,N);
y=rand(1,N);
D=[x;y]';
[v,c]=voronoin(D); % get edges
for p=1:N
r=rand()/2+0.5; % color: random light grey
col=[r r r];
patch(v(c{p},1),v(c{p},2),col); % color
hold on;
plot(x(p),y(p),'k.') % dot at "center"
end
voronoi(x,y,'k') % plot edges
axis equal
box on
xlim([0 1])
ylim([0 1])
|
| Sphere | |
![]() |
r=20; % resolution
a=2; % size of the sphere
xc=1;yc=2;zc=3; % coordinates of the center
alpha=0.5; % transparency
[x,y,z]=sphere(r);
figure(1)
clf;
surf(xc+x*a,yc+y*a,zc+z*a,'facecolor','blue','edgecolor','k','facealpha',alpha)
%colormap('jet') % colormap can be used if facecolor not used
xlabel('x');
ylabel('y');
zlabel('z');
|
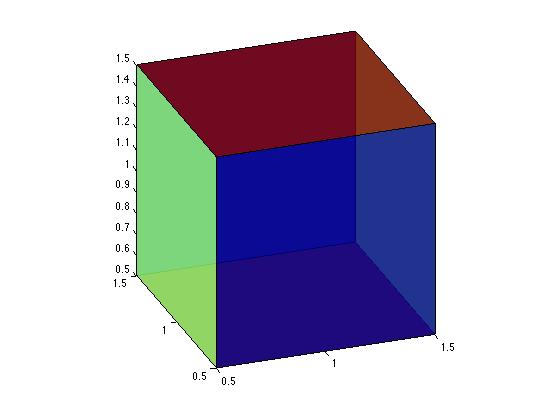
| Cube | |
![]() |
xc=1; yc=1; zc=1; % coordinated of the center L=1; % cube size (length of an edge) alpha=0.8; % transparency (max=1=opaque) X = [0 0 0 0 0 1; 1 0 1 1 1 1; 1 0 1 1 1 1; 0 0 0 0 0 1]; Y = [0 0 0 0 1 0; 0 1 0 0 1 1; 0 1 1 1 1 1; 0 0 1 1 1 0]; Z = [0 0 1 0 0 0; 0 0 1 0 0 0; 1 1 1 0 1 1; 1 1 1 0 1 1]; % C='blue'; % unicolor C= [0.1 0.5 0.9 0.9 0.1 0.5]; % color/face % C = [0.1 0.8 1.1 1.1 0.1 0.8 ; 0.2 0.9 1.2 1.2 0.2 0.8 ; % 0.3 0.9 1.3 1.3 0.3 0.9 ; 0.4 0.9 1.4 1.4 0.4 0.9 ]; % color scale/face X = L*(X-0.5) + xc; Y = L*(Y-0.5) + yc; Z = L*(Z-0.5) + zc; fill3(X,Y,Z,C,'FaceAlpha',alpha); % draw cube axis equal; AZ=-20; % azimuth EL=25; % elevation view(AZ,EL); % orientation of the axes |
| Multi-plot | |
![]() |
figure(1) clf; x=[0:10]; subplot(2,3,1) plot(x,x) subplot(2,3,2) plot(x,(x-5).^2) subplot(2,3,3) plot(x,1./(x+1)) subplot(2,3,4) plot(x,exp(x)) subplot(2,3,5) plot(x,sin(x)) subplot(2,3,6) plot(x,factorial(x)) |
| Multi-plot | |
![]() |
figure(1) clf; x=[-1:0.02:1]; subplot(2,2,[1 3]) plot(x,x.^2,'b.') subplot(2,2,2) plot(x,1./x,'r.') subplot(2,2,4) plot(x,cos(10.*x),'g.') |
| Multi-plot | |
![]() |
figure(1)
clf;
x=[0:0.01:20];
subplot('Position',[0.1 0.75 0.65 0.2])
plot(x,sin(x),'b')
subplot('Position',[0.2 0.45 0.65 0.2])
plot(x,cos(x),'b')
subplot('Position',[0.3 0.15 0.65 0.2])
plot(x,sin(x).*cos(x),'b')
|
| Inset | |
![]() |
figure(1)
clf;
x=[0:0.1:20]
y=sin(x)
subplot(1,1,1) ; % main plot
plot(x,y,'b')
xlabel('x','fontsize',18)
ylabel('sin(x)','fontsize',18)
axes('position',[0.5 0.6 0.3 0.2]) ; % inset
plot(x,abs(y),'r')
xlabel('x','fontsize',15)
ylabel('abs(sin(x))','fontsize',15)
|
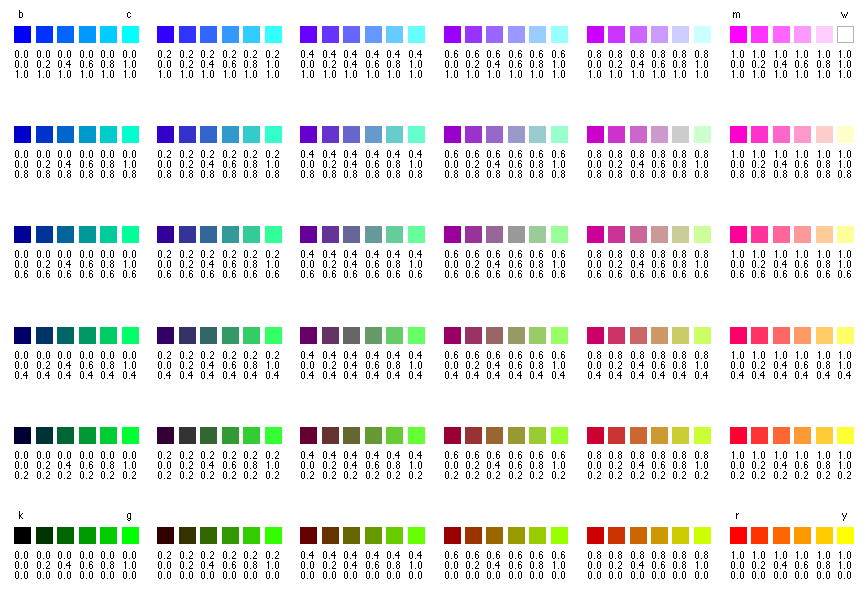
color=[r g b]; % r=red, g=green, b=blueSome colors can also be referred to by their "name". Examples:
color='b'; % blue color='k'; % black color='m'; % magentaHere is the code (r,g,b) and the name for different colors.
| Simulation | ||
| Simulating a discrete iterative system (logistic equation) | 25/1/2008 | logistic.m |
| Simulating a 2-ODE system (Bruxellator) | 29/1/2008 | brusselator.m |
| Simulating a 2-ODE system + plot the direction field (Toggle switch) | 31/1/2009 | togglequiver.m |
| Simulating a 2-ODE phase oscillator (limit-cycle phase oscillator) | 14/7/2008 | phaseoscillator.m |
| Simulating a 3-ODE system (FRQ model for circadian clock) | 25/1/2008 | frq.m |
| Simulating a 3-ODE system + sensitivity analysis (FRQ model for circadian clock) | 19/12/2012 | frqsensitivity.m |
| Simulating a forced 3-ODE system (FRQ model for circadian clock entrained by a LD cycle) | 29/1/2008 | frqforced.m |
| Simulating a perturbed 3-ODE system + phase response curve (FRQ model for circadian clock perturbed by a light pulse) | 22/7/2008 | frqprc.m |
| Simulating a 3-ODE system with a conditional resetting of a variable (Ruoff model) | 13/8/2009 | ruoff.m |
| Simulating a chaotic 3-ODE system (Rossler model) | 8/7/2008 | rossler.m |
| Simulating a 2-variable DDE system (Delay differential models for circadian clock: Scheper model with 1 delay + Sriram model with 3 delays) | 16/7/2008 | delaymodel1.m delaymodel2.m |
| Simulating a system of coupled oscillators (N x 4-ODE system) (Coupled Goodwin oscillators via (1) a mean field or (2) a coupling matrix) | 29/5/2008 | goodwinsynchro1.m goodwinsynchro2.m |
| Simulating a system with diffusion (1D and 2D simple Fick model) | 24/5/2008 29/5/2008 | fick.m fick2D.m |
| Simulating a reaction-diffusion system (Reaction-diffusion Brusselator - 2D) | 29/5/2008 | bruxRD2D.m |
| Simulating a reaction-diffusion system (Propagating front) | 8/9/2012 | RDfront.m |
| Simulating a stochastic system with the Gillespie algorithm (Stochastic FRQ model) | 13/7/2007 | frqstocha.m |
| Simulating a stochastic system with the Langevin algorithm (Stochastic Brusselator model) | 26/1/2007 | bruxLange.m |
| Time series analysis (deterministic time series) | ||
| Maxima (all maxima of a time series) | 28/10/2014 | maxima.m |
| Minima (all minima of a time series) | 28/10/2014 | minima.m |
| Period (for deterministic oscillations) | 2/1/2011 | period.m |
| Amplitude (for deterministic oscillations) | 2/1/2011 | amplitude.m |
| Phase (for deterministic oscillations) | 2/1/2011 | phase.m |
| Damping (for deterministic oscillations) | 2/1/2011 | damping.m |
| Poincare section | 8/3/2011 | poincare.m |
| Order parameter (for synchronized oscillations) | 19/10/2010 | orderparam.m |
| Time series analysis (stochastic time series) | ||
| Auto-correlation function (for stochastic oscillations) | 30/1/2008 | autocorrelation.m |
| Period distribution - naive approach (for stochastic oscillations) | 30/1/2008 | distriper.m |
| Period distribution using Hilbert transform (for stochastic oscillations) | 12/12/2009 | hilbertperiod.m |
| Fourier transform (for stochastic oscillations) | 9/7/2008 | myfft.m |
| Data analysis and statistics | ||
| Coefficient of determination (R-squared) | 14/4/2014 | rsq.m |
| Bray-Curtis distance | 3/8/2013 | braycurtis.m |
| Hurst exponent | 15/4/2014 | hurst.m |
| Data visualisation | ||
| Actogram (ex: actogram.png) | 21/10/2010 | actogram.m |
| Raster plot (ex: raster.png) | 29/12/2010 | raster.m |
| Graph (as in Graph theory) (ex: graph.png, graph2.png) | 4/8/2013 | graph.m graph2.m |
| Plot matrix (with color scale) (ex: plotmatrix.png) | 30/7/2014 | plotmatrix.m |
| Time series profile (ex: tsprofile.png) | 8/5/2014 | tsprofile.m |
| Plot color points (from a data matrix) (ex: plotcolorpoints.png) | 21/10/2015 | plotcolorpoints.m |
| Phase circle (ex: phasecircle.png) | 18/11/2015 | phasecircle.m |
| Simplex (ternary) plot (ex: simplex.png) | 10/12/2015 | simplex.m |
| Cellular automaton | ||
| Wolfram's automata (1D) (see some results here) | 27/7/2008 | wolfram.m |
| Game of Life (2D) (see some results here) | 27/7/2008 | gameoflife.m |
| Cell cycle automaton (see scheme of the model here and results here) | 6/11/2008 16/11/2008 | cdcautomaton.m cdcautoanim.m |
| Hubbell model (population dynamics) +spatial extension | 24/7/2012 | hubbell.m hubbell_spatial.m |
| Other automata (Langton's ant, Diffusion, Aggregation, Sand pile, etc) | 28/12/2010 | See here |
| Random walks | ||
| Random walk | 30/12/2008 | randomwalk.m |
| Brownian movement | 30/12/2008 | brownian.m |
| Fibonacci and Golden ratio | ||
| Fibonacci numbers | 31/12/2008 | fibonacci.m |
| Golden spiral | 31/12/2008 | goldspiral.m |
| Golden plant | 31/12/2008 | goldplant.m |
| Golden tree | 31/12/2008 | goldtree.m |
| Tournesol | 31/12/2008 | tournesol.m |
| Chaos and Fractals | ||
| Fractals: Cantor, Koch, Sierpinsky, Menger, Julia, Mandelbrot,... | 25/1/2008 | See here |
| Henon map | 21/11/2012 | henon.m |
| Baker's transform | 23/12/2012 | baker.m |
| Miscellaneous | ||
| Arrow (add arrow(s) on a plot) | 30/4/2015 | arrows.m |
| Circle | 2/8/2013 | circle.m |
| Moebius strip | 26/12/2011 | moebius.m |
| Perimeter of polygones | 3/11/2013 | polyperim.m |
| Intersection | 12/12/2013 | intersection.m |
| Voronoi neighbours (get neighbours in a Voronoi diagram) | 2/11/2013 | voroneighbours.m |
| Scale-free network | 25/4/2014 | SFnet.m |
| Image manipulation | ||
| Image deformations (applied here to clownfish1.jpg) | 21/7/2008 | imtransfo.m |
| Image colors changes (applied here to clownfish1.jpg) | 21/7/2008 | imcolor.m |
| Image superposition (applied here to clownfish1.jpg and clownfish2.jpg) | 21/7/2008 | imsuper.m |
| Photomaton (applied here to monalisa_256.jpg => monalisa_out.jpg) | 24/7/2010 | photomaton.m |
| Transformation du Boulanger (applied here to monalisa_256.jpg => monalisaboul.png) | 9/10/2011 | boulanger.m |
| Photocube (applied here to photo1.jpg+photo2.jpg+photo3.jpg => photocube.jpg) | 17/8/2012 | photocube.m |
| Animation | ||
| Rotating cube (see animation here) | 3/1/2009 | rotatingcube.m |
| Lighted sphere (see animation here) | 15/2/2009 | lightsphere.m |
| Transparent icosahedron (see animation here) | 15/2/2009 | icosahedron.m |